
There are several potential types of background and noise that can affect the observations; the main contributors being:
Earthshine
Zodiacal light
Geo-coronal emission Lines (UV)
Atmospheric helium (IR)
Thermal background (IR)
Dark current
Read noise (CCDs and NICMOS)
The sum of the External Background components is presented on the Results page. Note that each of the components of External Background can be switched off (set to None or No airglow) so that one of the components can be selected for display on the Results page. All components should be included when simulating observations, as artificially turning off the sky does not represent actual observing conditions.
Earthshine can vary strongly depending on the limb angle, on the fraction of the earth that is sun-lit, and on the fraction of cloud cover. At low limb angles, it can dominate the zodiacal light, which varies by only a factor of ~3 throughout the sky available to HST (See Giavalisco et al. WFC3 ISR 2002-12).
The table below lists the relative levels of Earthshine selectable in the ETC.
Table 1: Earthshine Background Contributions Relative to “High”
Level: |
None |
Average |
High |
Extremely High |
|---|---|---|---|---|
Earthshine |
0% |
50% |
100% |
200% |
Limb angle |
N/A |
50 deg |
38 deg |
24 deg |
The phase II special requirement LOW-SKY ensures that the limb angle will be greater than 40 degrees, i.e. that it will avoid the limb angle of the High Earthshine case by at least 2 deg. This requirement greatly reduces scheduling opportunities, so should be requested only when critical to the science and should be well justified in the phase I proposal.
The Zodiacal light values given in Table 2 are in ecliptic co-ordinates  (ecliptic latitude) and
  (helio-ecliptic longitude or
elongation). See the following figure.
(helio-ecliptic longitude or
elongation). See the following figure.
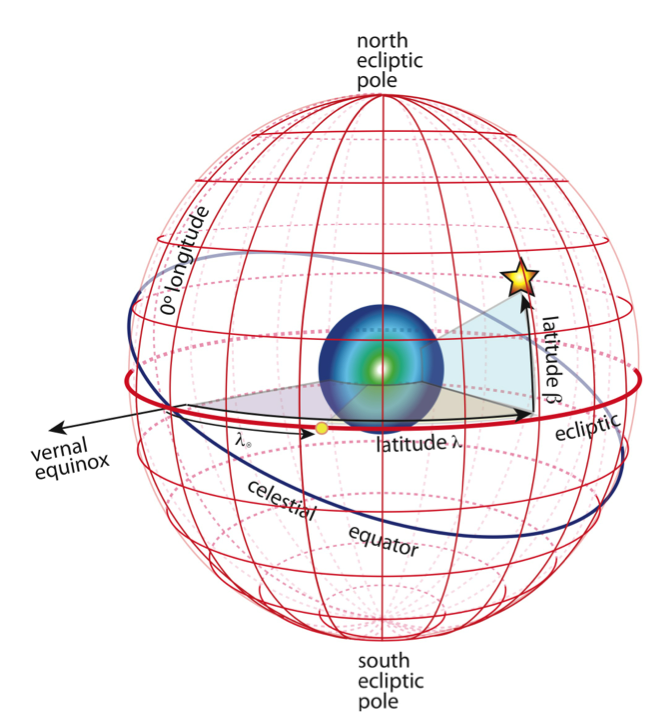
When a user request to calculate the contribution of the Zodiacal light with position, first the Equatorial coordinates are converted to Ecliptic coordinates. The relation between these set of coordinates is:
![\sin(\beta) = \sin(\delta) \cos(\epsilon) - \cos(\delta) \sin(\epsilon) \sin(\alpha) \ \ (i) \\
\cos(\lambda) = \cos(\alpha) \cos(\delta) / \cos(\beta) \ \ (ii) \\
\sin(\lambda) = [\sin(\delta) \sin(\epsilon) + \cos(\delta) \sin(\alpha) \cos(\epsilon) ] / \cos(\beta) \ \ (iii)](_images/math/c7a575a7d0e8f4d1553defb51279f422cd3cb7c8.png)
or
![\sin(\beta) = \sin(\delta) \cos(\epsilon) - \cos(\delta) \sin(\epsilon) \sin(\alpha) \ \ (iv) \\
\tan(\lambda) = [\tan(\delta) \sin(\epsilon) + \cos(\epsilon) \sin(\alpha) ] / \cos(\alpha) \ \ (v)](_images/math/bb3d77efa8be4ac964648726f3a8bd4bed5126d1.png)
 = right ascension
 = declination
 = obliquity of the ecliptic with
  for equinox 1950.
Since we know we can then use (i) and (ii) to calculate
and  .
.
To solve for the ambiguity of the sign you should calculate the equations (iii) and (v) and
if  and
and  and
and  then
then 
if  and
and  and then
if and and then 


The ETC then calculates the helio-ecliptic logitude or elongation (sun angle between sun-earth and earth particle) to determine the brightness along the line of sight:

 is the equatorial longitude of the Earth
 is derived as follows:

 is the number of days from the Vernal Equinox of the selected year (March 20).
Once the Helioeclipic coordinates are calculated, the ETC performs a bilinear interpolation using the values in Table 2 in order to derive the Johnson V magnitude for the Zodiacal contribution. The result is then fed to the pysynphot task renorm to renormalize the Zodiacal light spectrum model (currently zodiacal_model_001.fits) to the derived V magnitude.
Table 2 provides the approximate values of the Zodiacal light background
( ) in ecliptic latitude () and helio-ecliptic
longitude (
) in ecliptic latitude () and helio-ecliptic
longitude ( ). The SE values
correspond to the solar exclusion zone. This table has been updated for cycle 24 using a
finer grid to provide better estimates of the zodiacal light as a target approaches the
50 degree HST-to-target limiting angle. It was again modified for ETC 29.1 to correct
typos in a few positions (marked with ‘*’).
). The SE values
correspond to the solar exclusion zone. This table has been updated for cycle 24 using a
finer grid to provide better estimates of the zodiacal light as a target approaches the
50 degree HST-to-target limiting angle. It was again modified for ETC 29.1 to correct
typos in a few positions (marked with ‘*’).
Table 2: Zodiacal Light Background Contributions
|
|
||||||||||||
|---|---|---|---|---|---|---|---|---|---|---|---|---|---|
0 |
5 |
10 |
15 |
20 |
25 |
30 |
35 |
45 |
50 |
60 |
75 |
90 |
|
0 |
SE |
SE |
SE |
SE |
SE |
SE |
SE |
SE |
SE |
22.0708 |
22.5136 |
22.9538 |
23.2298 |
5 |
SE |
SE |
SE |
SE |
SE |
SE |
SE |
SE |
SE |
22.0816 |
22.5136 |
22.9538 |
23.2298 |
10 |
SE |
SE |
SE |
SE |
SE |
SE |
SE |
SE |
SE |
22.1033 |
22.5210 |
22.9538 |
23.2298 |
15 |
SE |
SE |
SE |
SE |
SE |
SE |
SE |
SE |
SE |
22.1454 |
22.5360 |
22.9538 |
23.2298 |
20 |
SE |
SE |
SE |
SE |
SE |
SE |
SE |
SE |
SE |
22.2004 |
22.5743 |
22.9649 |
23.2298 |
25 |
SE |
SE |
SE |
SE |
SE |
SE |
SE |
SE |
22.0808 |
22.2586 |
22.6141 |
22.9762 |
23.2298 |
30 |
SE |
SE |
SE |
SE |
SE |
SE |
SE |
SE |
22.1578 |
22.3237 |
22.6554 |
23.0107 |
23.2298 |
35 |
SE |
SE |
SE |
SE |
SE |
SE |
SE |
21.9203 |
22.2350 |
22.3924 |
22.7071 |
23.0224 |
23.2298 |
40 |
SE |
SE |
SE |
SE |
SE |
SE |
21.8257 |
22.0287 |
22.3181 |
22.4628 |
22.7522 |
23.0343 |
23.2298 |
45 |
SE |
SE |
21.0810 |
21.3356 |
21.5717 |
21.7872 |
21.9545 |
22.1379 |
22.3948 |
22.5232 |
22.7801 |
23.0707 |
23.2298 |
50 |
20.8432 |
21.0663 |
21.3194 |
21.5397 |
21.7408 |
21.9486 |
22.0833 |
22.2472 |
22.4715 |
22.5837 |
22.8080 |
23.1071 |
23.2298 |
60 |
21.1844 |
21.3356 |
21.5842 |
21.7872 |
21.9859 |
22.1525 |
22.2937 |
22.4437 |
22.6304 |
22.7237 |
22.9104 |
23.1212 |
23.2298 |
75 |
21.6258 |
21.6965 |
21.8737 |
22.0611 |
22.2180 |
22.3621 |
22.4989 |
22.6319 |
22.7801 |
22.8542 |
23.0024 |
23.1607 |
23.2298 |
90 |
21.9155 |
21.9768 |
22.0660 |
22.2350 |
22.3948 |
22.5284 |
22.6470 |
22.7699 |
22.9104 |
22.9807 |
23.1212 |
23.2016 |
23.2298 |
105 |
22.1315 |
22.1419 |
22.2124 |
22.3686 |
22.5136 |
22.6387 |
22.7614 |
22.8912 |
22.9990 |
23.0529 |
23.1607 |
23.2298* |
23.2298 |
120 |
22.2639 |
22.2757 |
22.3305 |
22.4844 |
22.5980 |
22.7071 |
22.8186 |
22.9646 |
23.0707 |
23.1237 |
23.2298 |
23.2736 |
23.2298 |
135 |
22.3181 |
22.3243 |
22.3948 |
22.5284 |
22.6304 |
22.7339 |
22.8483 |
22.9224* |
23.0707 |
23.1237* |
23.2298* |
23.2885 |
23.2298 |
150 |
22.3181 |
22.3243 |
22.4014 |
22.5210 |
22.6060 |
22.6896 |
22.7801 |
22.8639 |
22.9990 |
23.0665 |
23.2016 |
23.3037 |
23.2298 |
165 |
22.2180 |
22.2407 |
22.3181 |
22.4014 |
22.4989 |
22.5743 |
22.6554* |
22.7435 |
22.9104 |
22.9938 |
23.1607 |
23.3037 |
23.2298 |
180 |
22.0418 |
22.1315 |
22.2236 |
22.3243 |
22.4216 |
22.5210 |
22.6304 |
22.7348 |
22.8998 |
22.9823 |
23.1473 |
23.3037 |
23.2298 |
Derived from Leinert, et al. (1998), Table 17.
This is used to normalize the Zodiacal Light spectra used by the ETC and shown in the figure below.
Table 3: Geo-Coronal Emission Line Properties
Line |
Low |
Average |
High |
||||
|---|---|---|---|---|---|---|---|
Wavelength Angstrom |
Flux(erg cm^-2 s^-1) |
FWHM Angstrom |
Flux(erg cm^-2 s^-1) |
FWHM Angstrom |
Flux(erg cm^-2 s^-1) |
FWHM Angstrom |
|
Lyman_Alpha |
1215.7 |
6.1e-14 |
0.04 |
3.05e-13 |
0.04 |
6.1e-13 |
0.04 |
O_I |
1302 |
3.8e-16 |
0.013 |
2.85e-14 |
0.013 |
5.7e-14 |
0.013 |
O_I |
1356 |
3.0e-17 |
0.013 |
2.5e-15 |
0.013 |
5.0e-15 |
0.013 |
O_II |
2471 |
1.5e-17 |
0.023 |
1.5e-15 |
0.023 |
3.0e-15 |
0.023 |
The strength of the geo-coronal Lyman alpha varies between about 2 and 20 kilo Rayleighs, depending on the time of observations and the position of the target relative to the Sun, and can be kept low by the special requirement “SHADOW”. For more details, see the corresponding Instrument Handbook.
Short-wavelength WFC3/IR imaging filters (F105W and F110W) and WFC3/IR grisms (G102 and G141) are subject to excess background emission caused by metastable Helium atoms in the solar-illuminated upper atmosphere. The background is due to He I emission at 10830 Angstrom. Its contribution is negligible in Earth’s shadow but increases sharply when the telescope is outside of shadow (up to 5 e-/s/pix in extreme cases). The He background also increases with decreasing limb angle, but can still be significant as high as 40 degrees above the Earth limb. For more information on this background component, see WFC3/ISR 2014-03 (Brammer et al.)
The contribution of atmospheric helium to the WFC3 background is negligible in Earth’s shadow, corresponding to the “None” default ETC setting. The “Average”, “High” and “Very High” values implemented in the ETC correspond to 0.1, 0.5, and 1.5 e-/sec/pix in F105W and are the 50, 75, and 95 percentile fluxes of the excess flux, per exposure, from the Helium line determined from archival observations. The ETC model of this emission is a gaussian source at 10830 Angstrom with FWHM = 2 Angstrom.
An empirical model of the ACS/SBC total background was included in the ETC in 34.1. This model replaces the combined earthshine, zodiacal light, geo-coronal airglow emission, and dark rate with a filter-dependent total background count rate. Values were updated to correct a bug in the ETC 34.1.1 release.
Analysis of the >20 years of ACS/SBC observations has demonstrated that the background is highly variable. However, the background encountered in practice is usually significantly lower than what had been previously estimated by the ETC for the filters where airglow typically dominates over the dark rate (F115LP, F122M, F125LP, and F140LP). Specifically, the median background found in archival ACS/SBC data is lower than the previous ETC predictions (when using “medium” airglow) by factors of 2.51, 2.64, 105, and 3.64, for F115LP, F122M, F125LP, and F140LP, respectively. Therefore, the empirical ACS/SBC background model should indicate the range of backgrounds that users can generally expect to encounter. The figures below show the distribution of total backgrounds found in archival data for each filter, with the average dark rate shown for comparison.
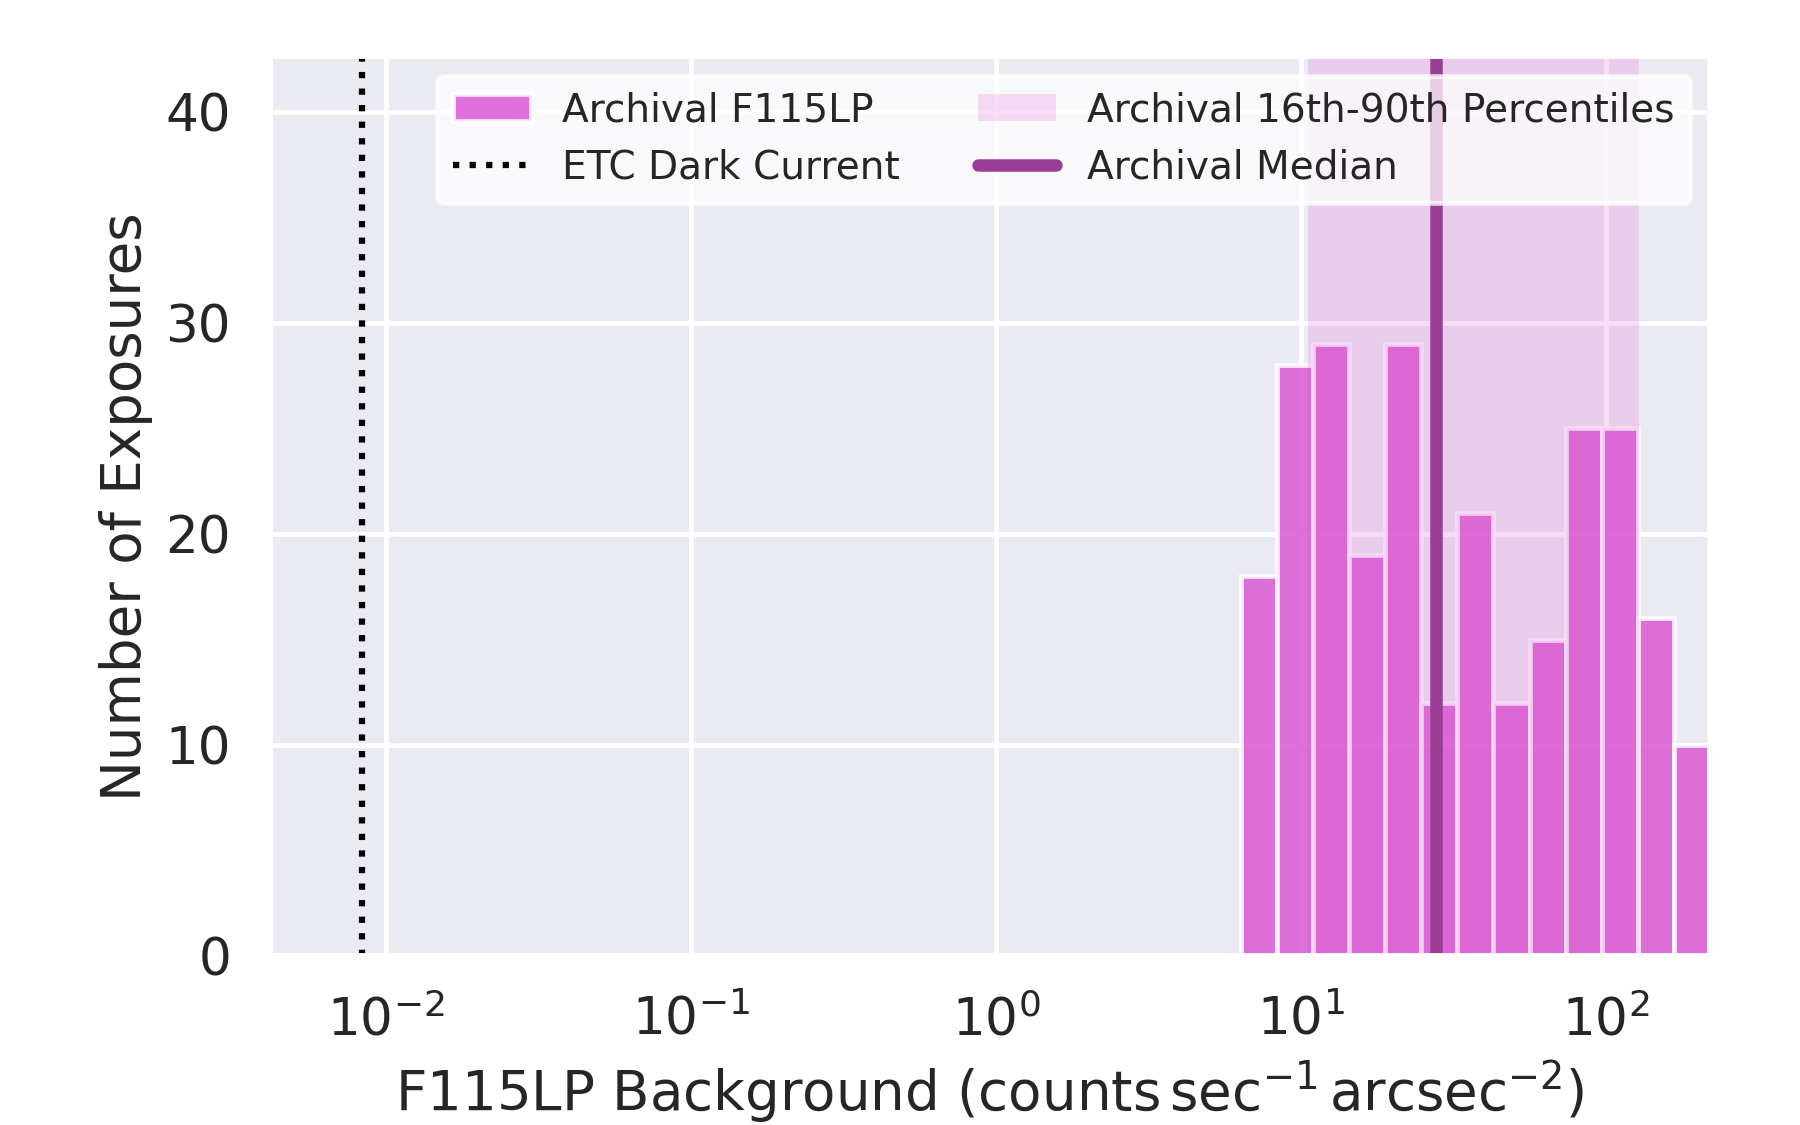
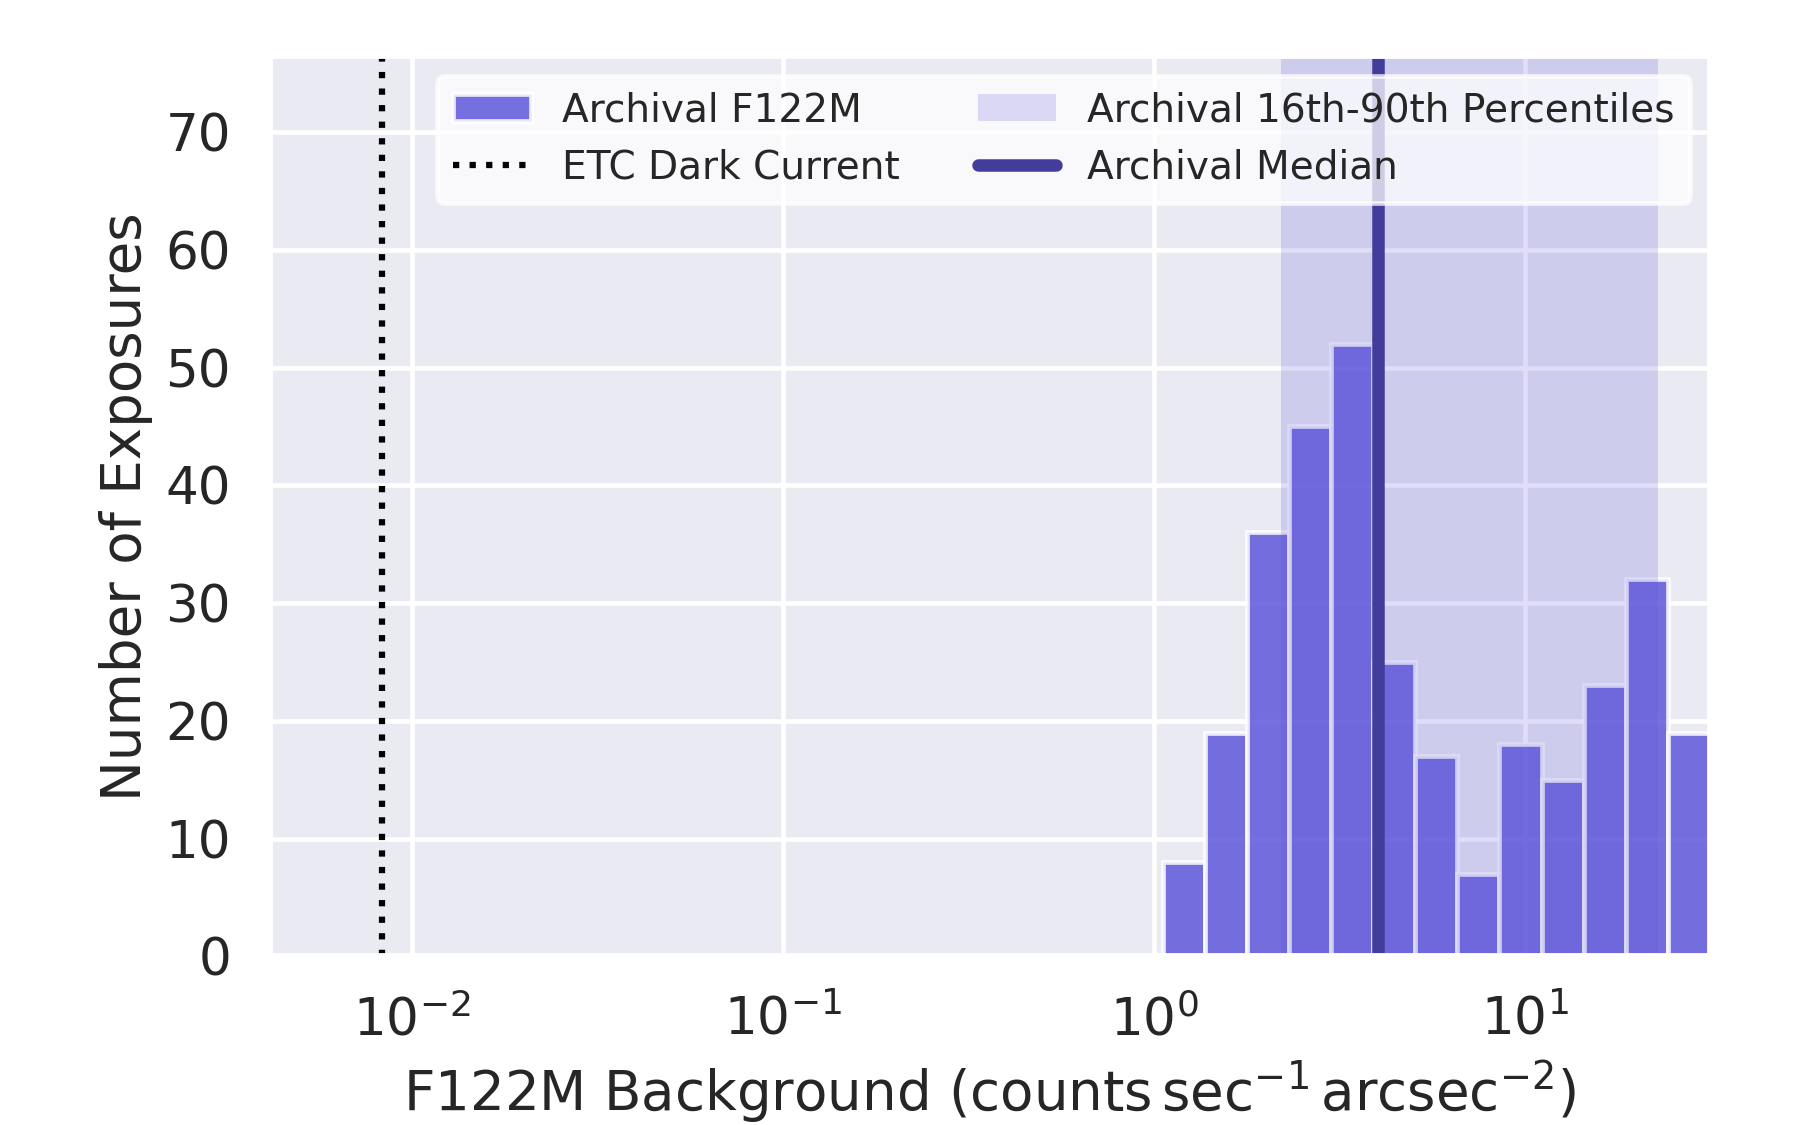
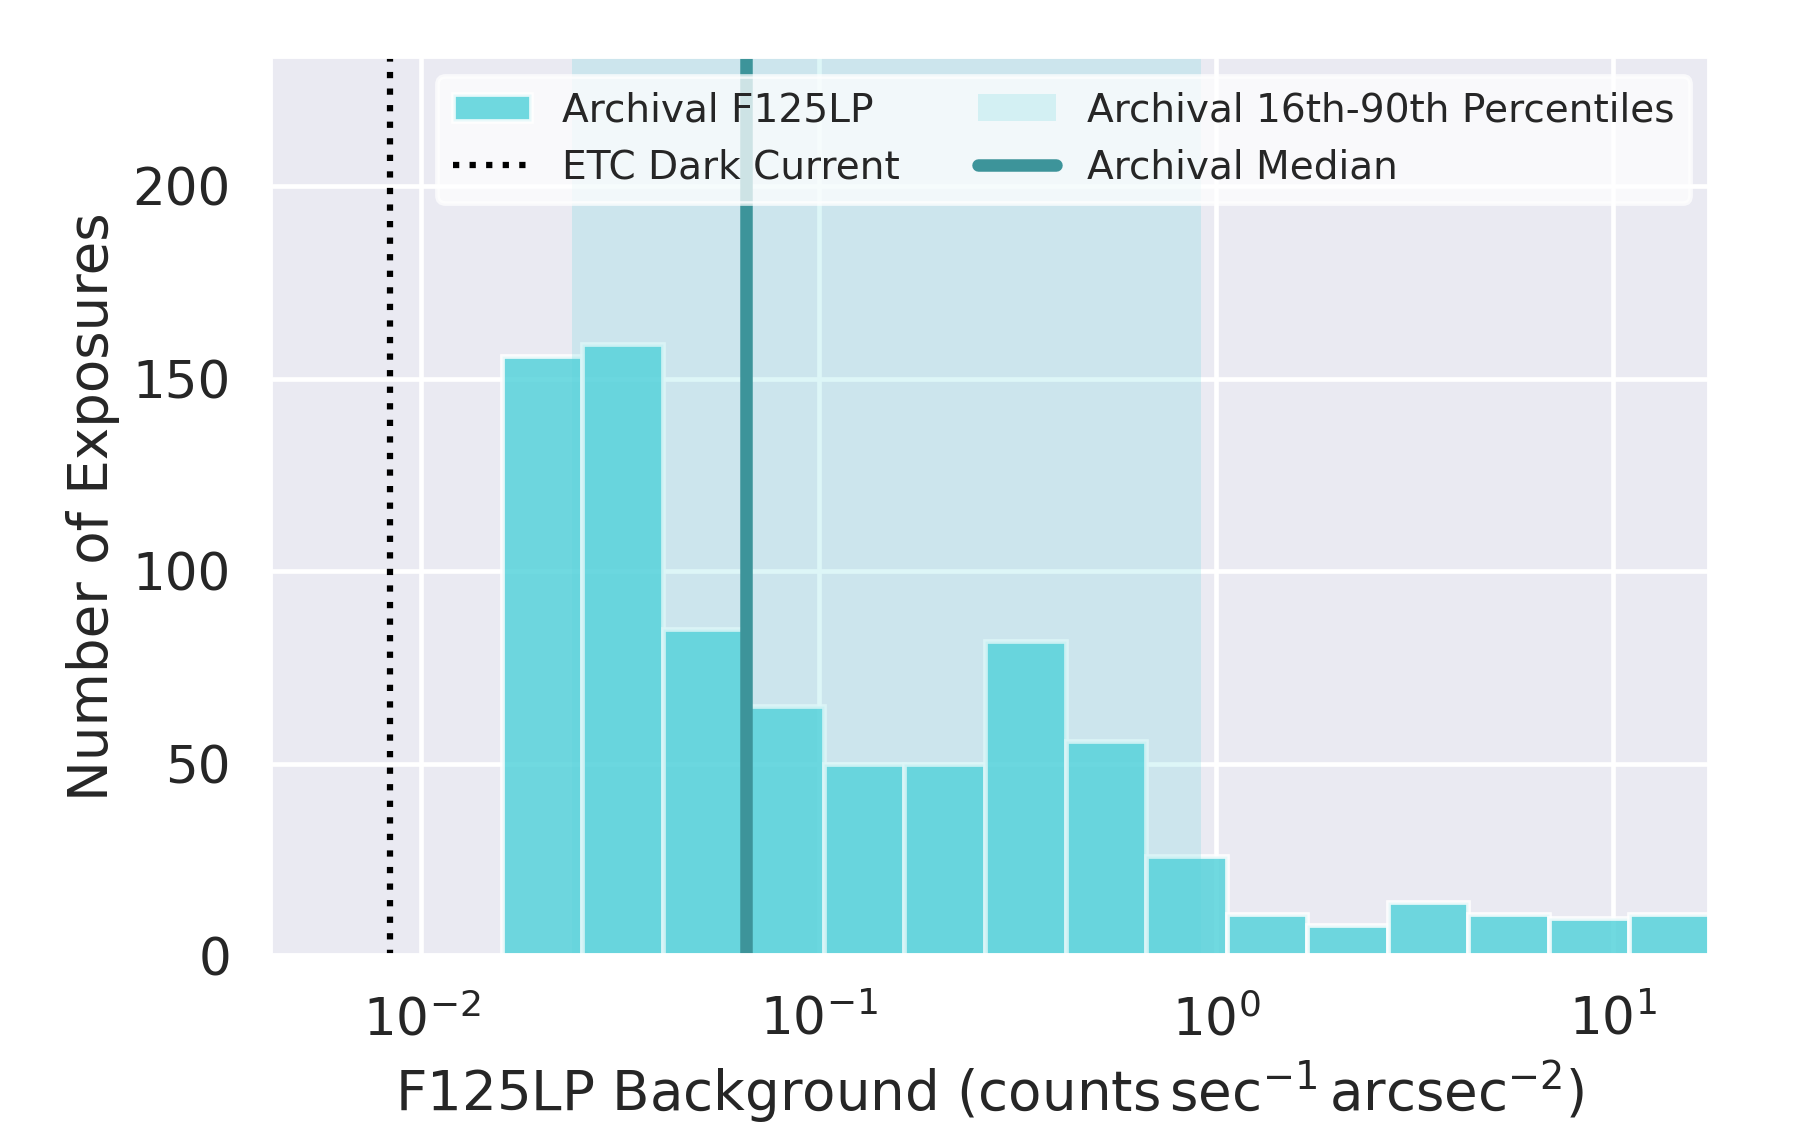
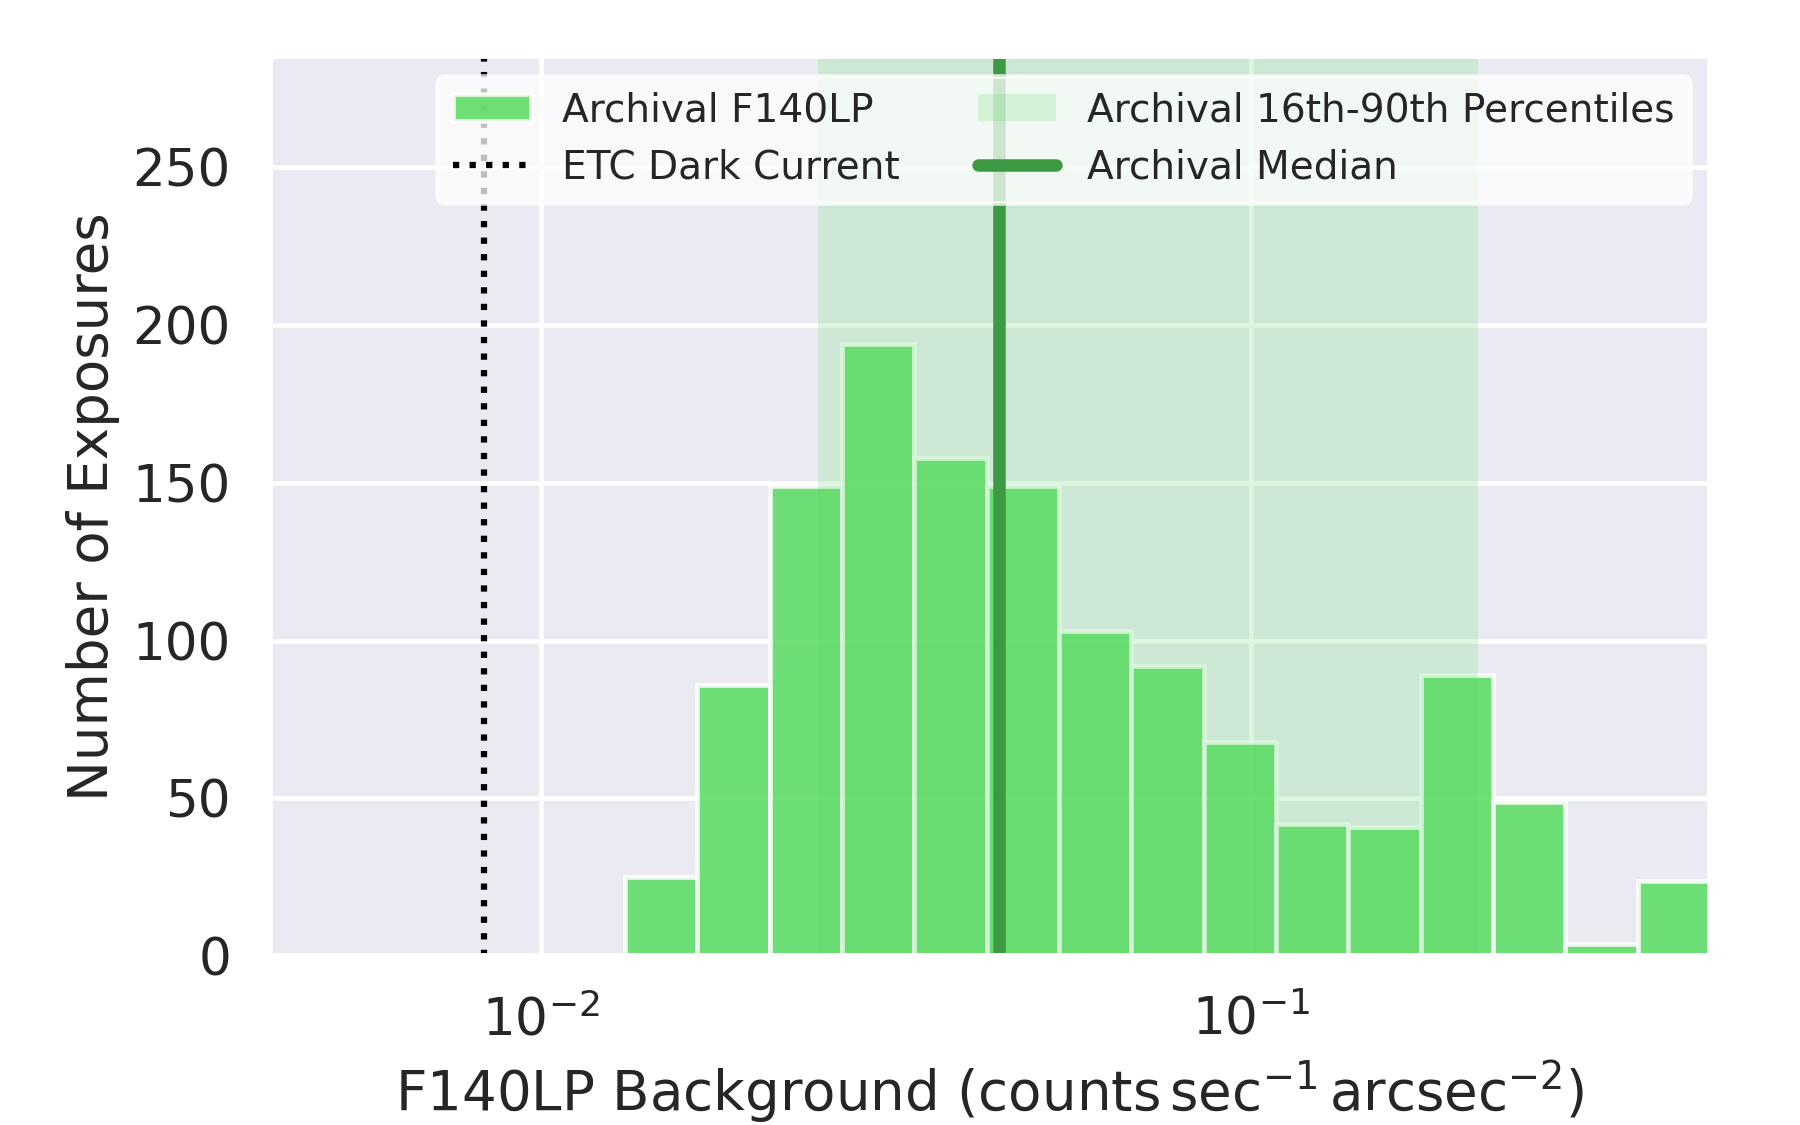
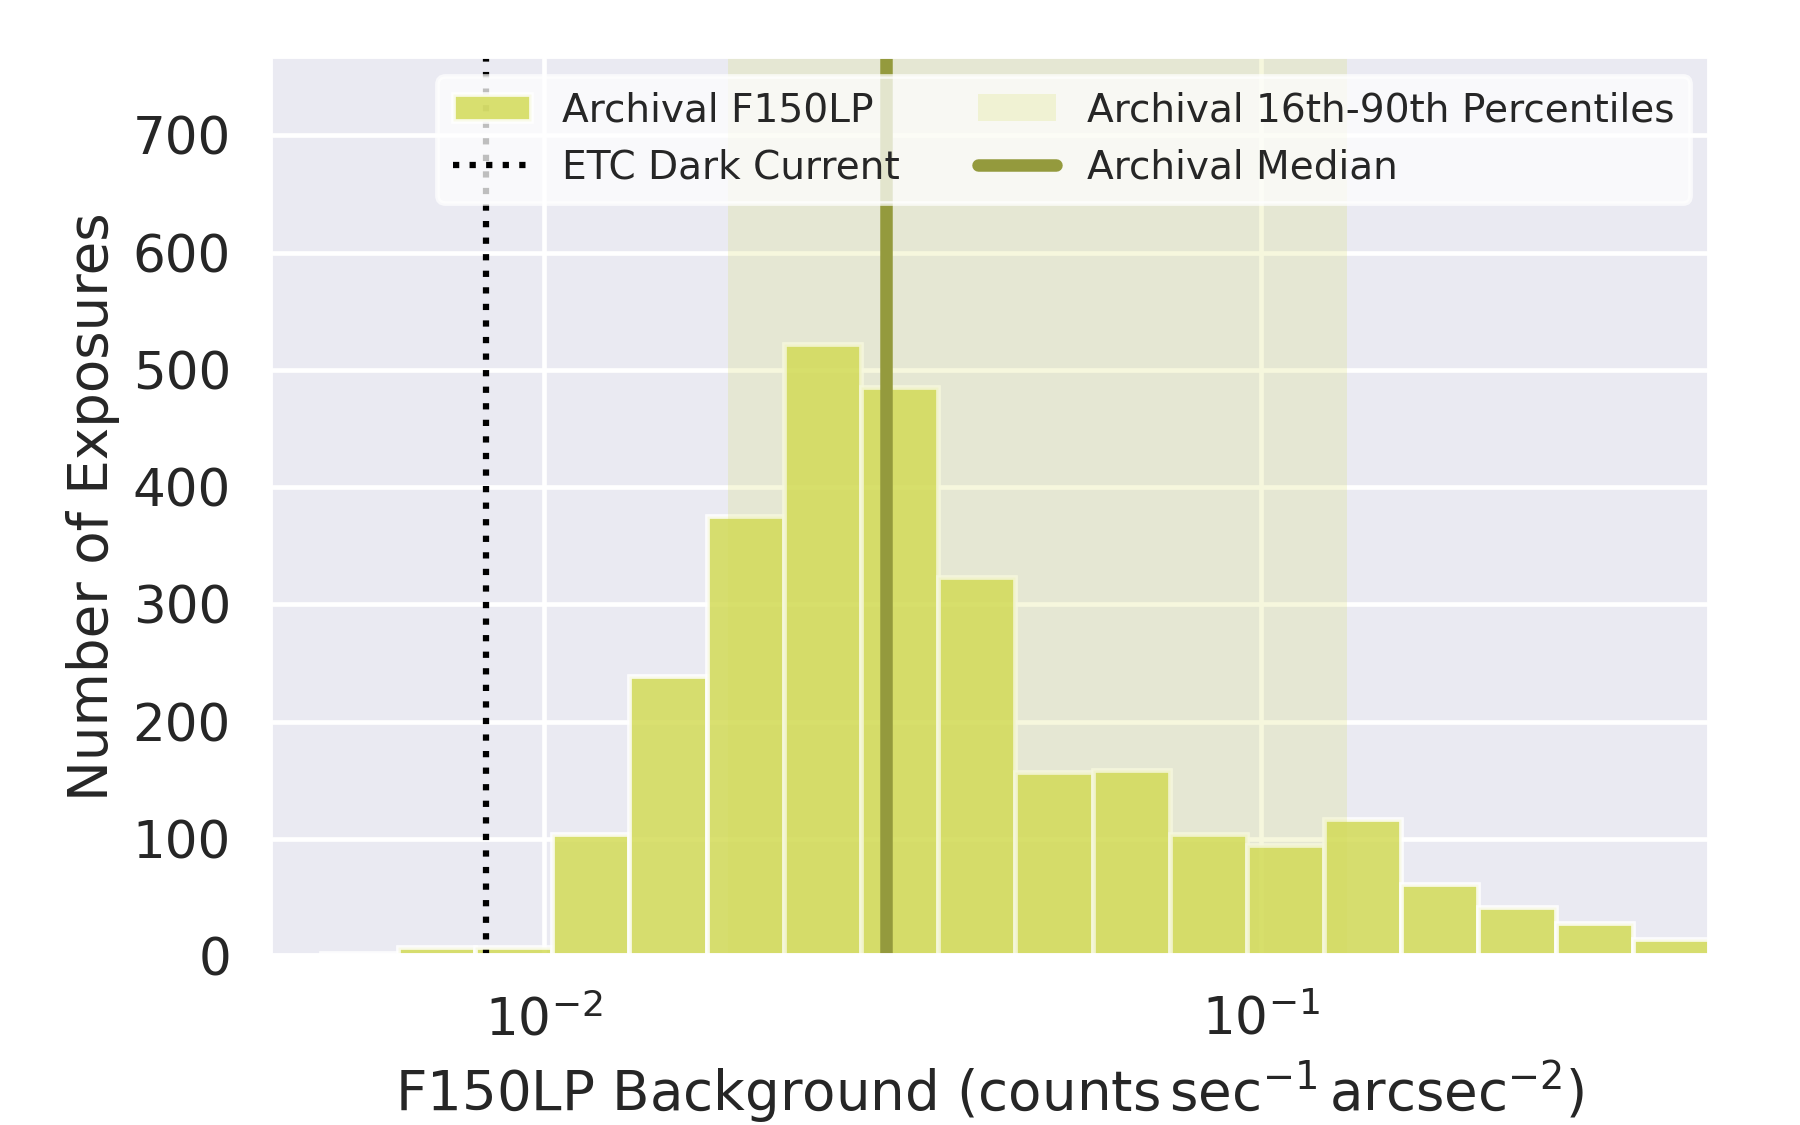
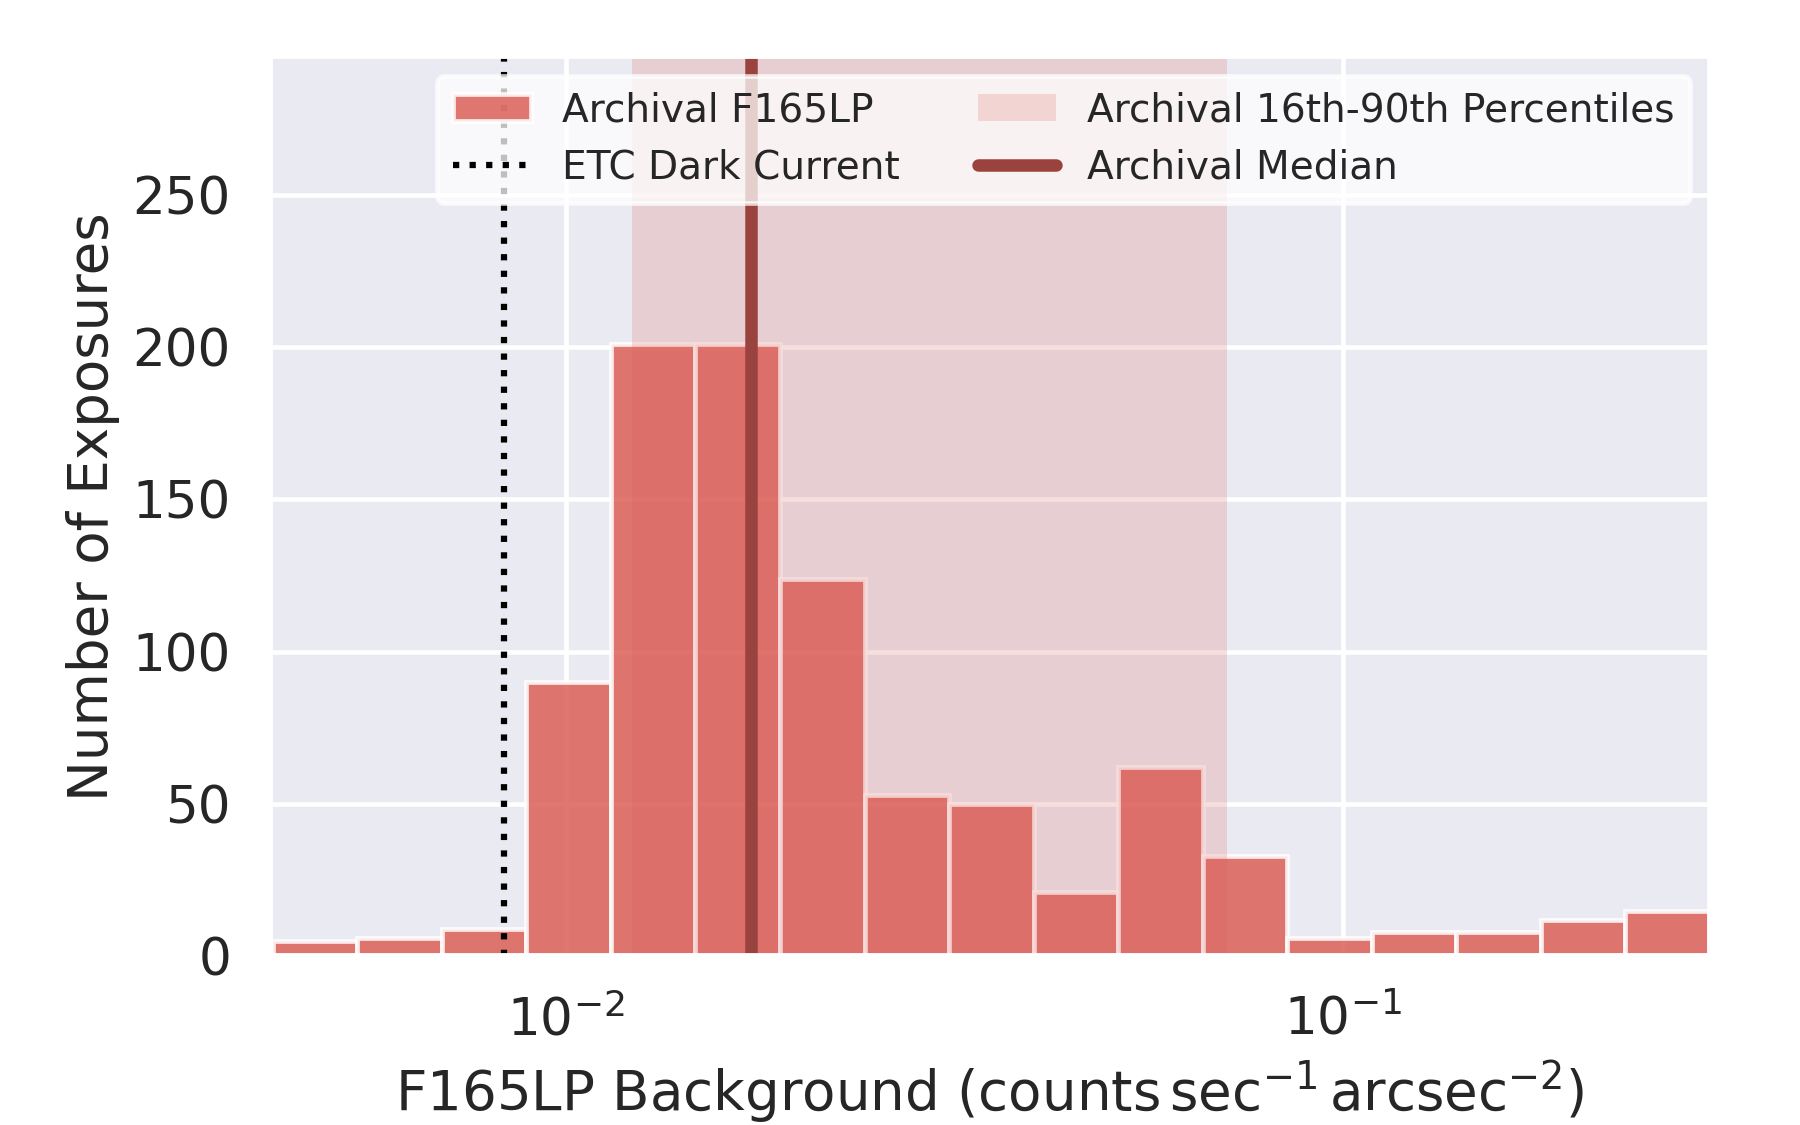
These empirical backgrounds include the contribution of the ACS/SBC dark rate. However, users should note that the dark rate varies over the detector, particularly as the instrument warms up over the course of subsequent exposures (see §4.5.3 of the ACS Instrument Handbook). This is especially important to consider for observations where the background is dominated by the dark rate, which is not uncommon when using F150LP or F165LP.
Level |
Percentile |
F115LP |
F122M |
F125LP |
F140LP |
F150LP |
F165LP |
|---|---|---|---|---|---|---|---|
low |
16th |
10.53 |
2.197 |
0.02393 |
0.02456 |
0.01805 |
0.01214 |
medium |
50th |
27.73 |
4.011 |
0.06578 |
0.04416 |
0.02999 |
0.0173 |
high |
90th |
128.5 |
22.82 |
0.9162 |
0.2088 |
0.1317 |
0.07084 |
Empirical background values (counts  s-1 arcsec-2).
For full details of how the empirical background model was derived, and what effects can increase or decrease the background, see ISR ACS 2025-XX (publication pending).
The thermal background is negligible below about 8000 Angstrom and increases slowly towards longer wavelengths. For WFC3/IR, the thermal count rate (per unbinned pixel) is calculated by an algorithm that is described in detail in “Thermal Background Limitations for IR Instrumentation Onboard HST”, Sosey, M., Wheeler, T., Sivaramakrishnan, A., 2003, NICMOS ISR 2003-007.
Detector dark current is an intrinsic source of background counts. The dark current rate is dependent upon the detector design and temperature. It is measured in counts per unbinned pixel per second. For CCDs, 1 count = 1 e-; for MAMAs, 1 count results from each charge cloud detected.
CCD detectors and the WFC3 IR detector are subject to noise caused by the process of reading out the charge accumulated by the pixels. The amount of read noise varies by detector and as a function of gain. CCD read noise is measured per binned pixel, per read. WFC3/IR read noise per pixel is measured by a linear fit to a complete sequence of 15 reads. Fewer reads (smaller NSAMP) result in greater read noise, not taken into account in the computation. (See WFC3 ISR 2009-21).
Table 4: Dark Current and Read Noise Values
Instrument |
Detector |
Dark Current |
Read Noise |
|---|---|---|---|
(counts |
(counts |
||
ACS |
HRC |
0.058 |
4.7 (for gain=2.0) |
SBC |
8.52e-6 |
N/A |
|
WFC |
0.0175 |
4.45 (for gain=2.0) |
|
COS |
FUVB |
4.57e-6 (target acquisition) |
N/A |
FUVA |
4.60e-6 (target acquisition) |
|
|
FUVB |
2.66e-6 (spectroscopic) |
|
|
FUVA |
2.61e-6 (spectroscopic) |
|
|
NUV |
1.04e-3 |
N/A |
|
STIS |
CCD |
0.028 (low; top of detector) |
6.65 (for gain=1); 9.0 (for gain=4) |
0.035 (medium; middle of detector) |
|
||
0.042 (high; bottom of detector) |
|
||
FUV |
3.0e-5 (no glow component) |
N/A |
|
7.5e-5 (low glow component) [1] |
|
||
1.5e-4 (medium glow component) |
|
||
4.0e-4 (high glow component) |
|
||
NUV |
0.00076 |
N/A |
|
WFC3 |
IR |
0.02 |
14.6 (for gain=2.5) |
UVIS1 |
0.00285 ADU/s/pix = 0.004275 counts/s/pix |
3.0 (for gain=1.5) |
|
UVIS2 |
0.00301 ADU/s/pix = 0.004515 counts/s/pix |
3.0 (for gain=1.5) |
If you have any questions regarding this calculator, please contact the STScI HST Help Desk. Remember to include your ETC ID.
![]()
